Improving Accessibility with Analytics @ Acquia Engage 2025
- by Vincent de Winter
- 26 May 2025
How do you ensure digital channels not only comply with accessibility regulations but truly work for all users? During the Acquia Engage Conference in London, Lars Holm Sørensen (Accessibility Expert at Acquia Optimize) and I gave a joint presentation centered on this question. In this article, I’ll share the key insights from our presentation — and show how empathy and data can reinforce each other.
Acquia Optimize: Data-driven accessibility improvement
Acquia Optimize, the platform Lars is involved with, helps organizations systematically improve accessibility based on behavioral data and continuous feedback. But why is digital accessibility not just a technical requirement, but also a strategic advantage?
Accessibility: essential for some, valuable for all
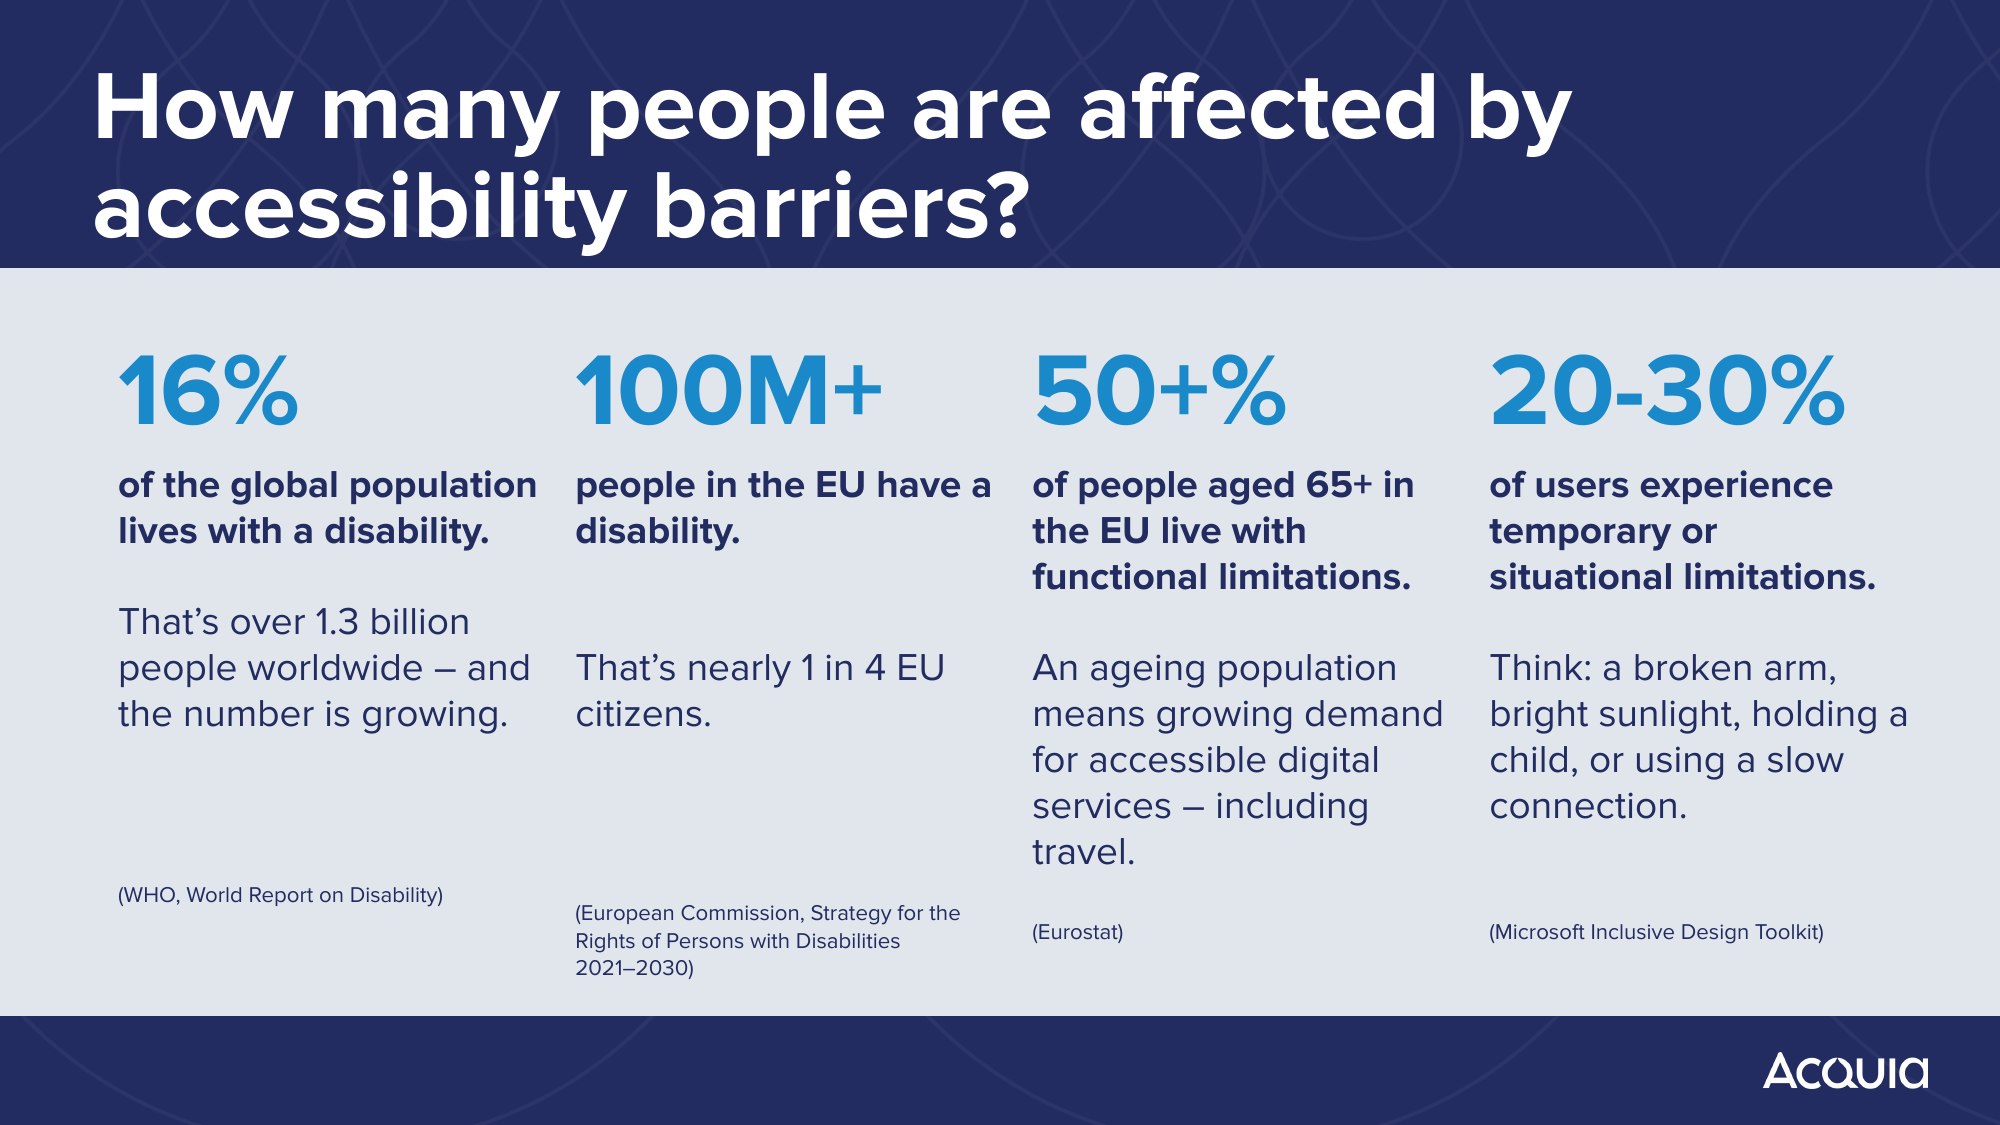
Accessibility is not a nice-to-have. Over 1.3 billion people worldwide live with some form of disability. And consider temporary or situational impairments: a broken arm, bright sunlight on your screen, or holding a baby while browsing.
Lars opened our session with a powerful message: accessibility is not just a technical or legal topic — it’s a human right. Without accessible websites, we unconsciously exclude people from education, work, or services.
Lars' user experience: relying on a screen reader
Lars shared two examples of his experience booking travel online. What seems like a simple task to most becomes a complex maze for him. Forms aren’t labeled, error messages are invisible to his screen reader, and keyboard navigation often leads to dead ends.

How hard can it be to book a plane ticket from Copenhagen to London? There’s no better way to make this clear than with the video below. Experience firsthand the output of Lars’ screen reader:
Video Experience: Lars Booking a Trip with a Screen Reader.mp4 These examples visibly impacted the audience. They made it clear why accessibility must always start with the real user experience.
How analytics reveal accessibility gaps with Acquia Optimize
Many organizations rely on audits or checklists but overlook that analytics can reveal invisible problems. So how can you integrate accessibility into your analytics strategy?
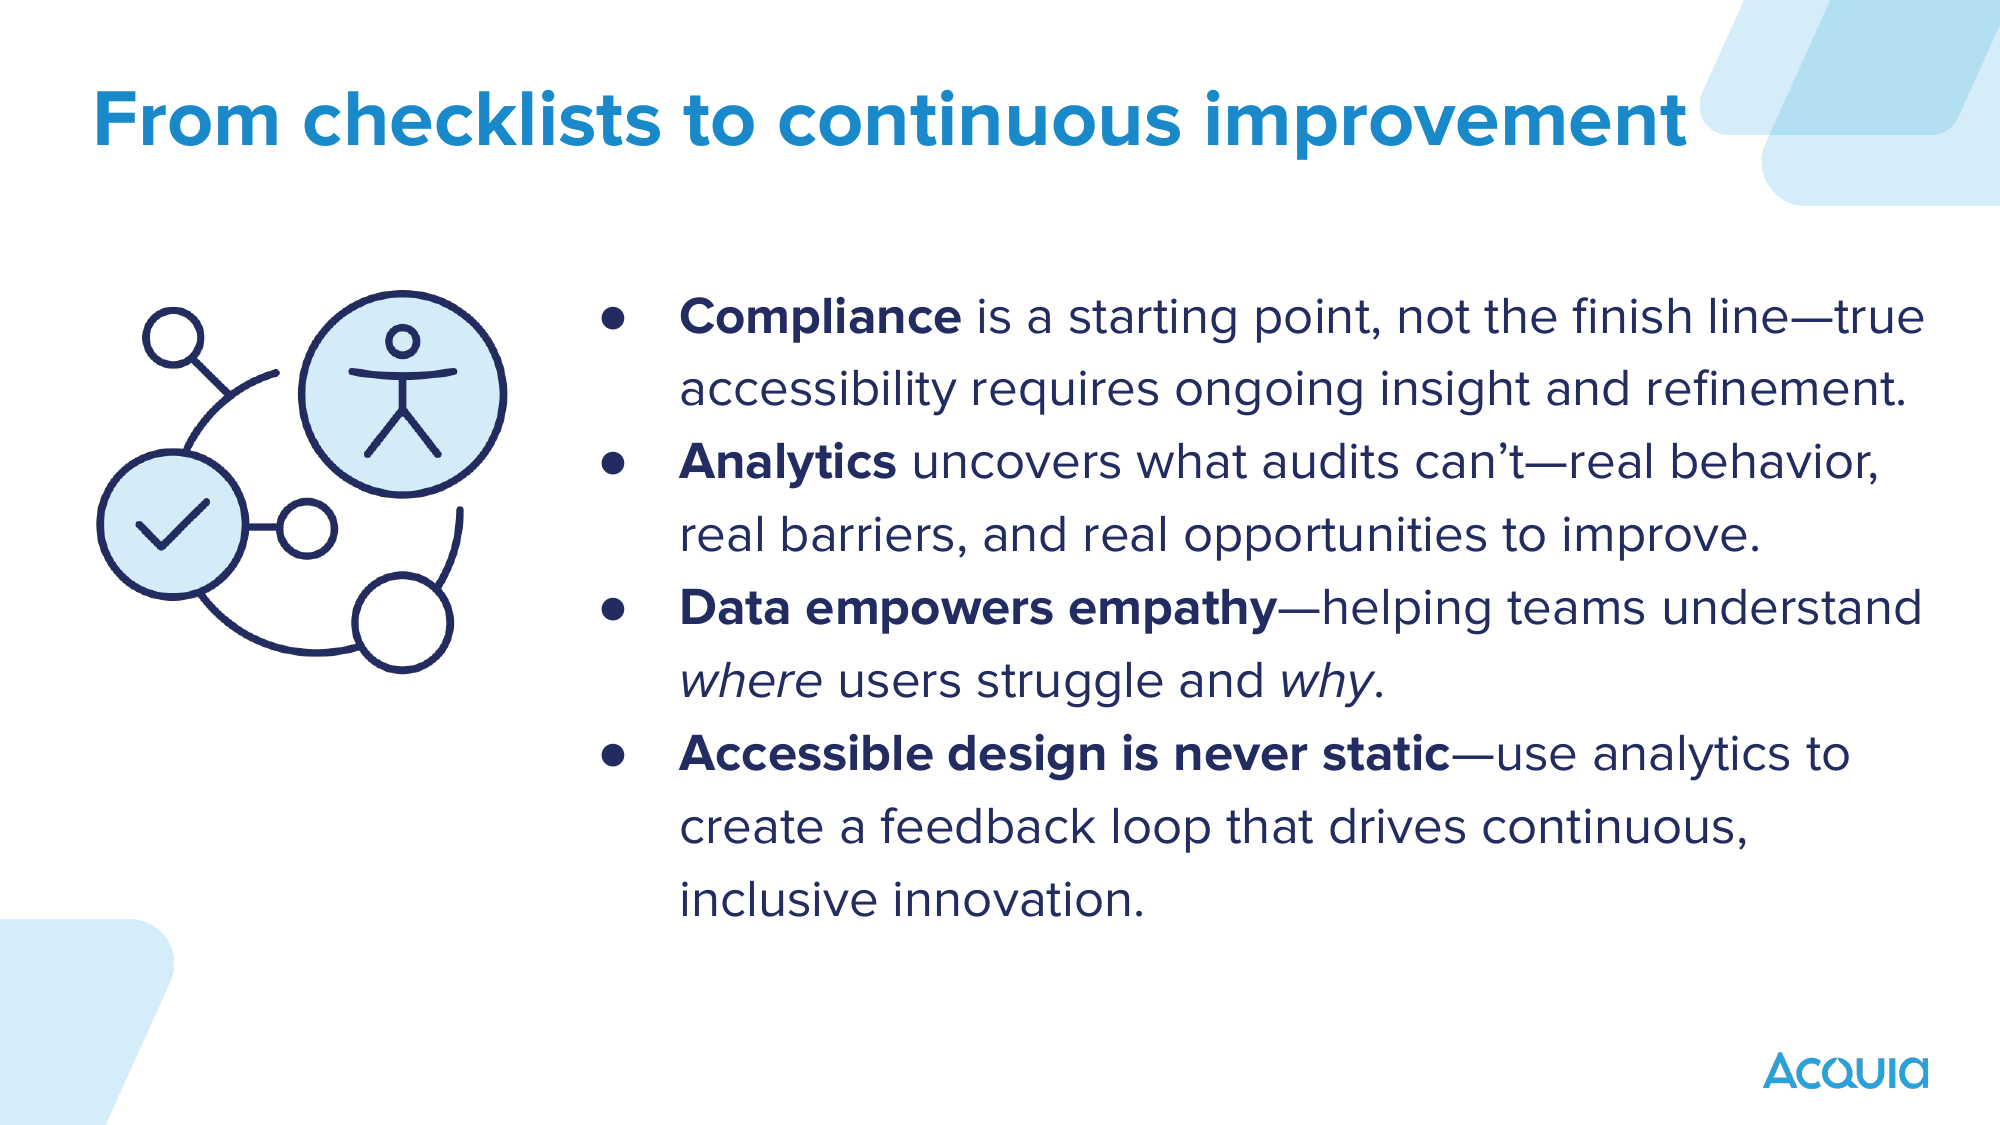
Even when websites technically meet WCAG guidelines, users with disabilities still face major hurdles. Traditional audits detect code issues, but tell you nothing about how users actually move through your site — or where they get stuck. That’s where analytics comes in. Behavioral data helps uncover blind spots in the user experience.
- Web analytics show where users hesitate or drop off, such as unclear navigation, inaccessible buttons, or frustrating form interactions.
- They highlight the difference between compliance and usability: where technical checks see no problems, data reveals behavior that suggests otherwise.
- Insights from analytics help you prioritize based on evidence, not assumptions.
- Analytics give users a voice, even if they don't complain: especially users with disabilities often remain invisible in traditional feedback channels. Data lets you learn from their experience anyway. In short, analytics transform abstract problems into concrete, measurable opportunities for improvement. Accessibility becomes not just a technical requirement, but a core element of an empathetic, data-driven optimization strategy.
Integrating accessibility into analytics and optimization strategies
Combining technical audits with behavioral data gives a more complete picture. You not only see where you legally fall short, but also where people get stuck in practice. With tools like Piwik PRO, for example, you can measure keyboard usage, track ARIA errors, and segment input behavior by device. By including accessibility in your tagging and dashboards, it becomes a standard — not an afterthought — in your optimization process.
A key point from the presentation: accessibility must be built-in, not bolted-on. That requires collaboration between development, UX, analytics, and compliance. And above all: a mindset of continuous improvement, centered on the user.
By including accessibility KPIs in your optimization dashboards and A/B tests, it becomes part of your digital DNA. And those who use data to build empathy not only create better services — but also a more just digital society.
“Let your data speak — and let empathy grow.”
Data isn’t just a tool for optimization; it’s also a bridge to greater understanding. By measuring where users get stuck, skip steps, or hesitate, a story emerges that audits alone can’t tell. These insights don’t just make accessibility issues visible — they make them felt. And that’s where empathy begins.
Further reading on accessibility and analytics
Here are some helpful resources and further reading:
- WCAG 2.2 Guidelines (w3.org) The international standard for digital accessibility.
- Inclusive Design Principles - Practical guidelines for designing inclusive interfaces.
- The Cost of Exclusion (Microsoft Design) - Why accessibility benefits everyone — with concrete examples.